Have you ever met a marketer who didn’t want to know more about their customers? Me either. Marketing 101 teaches you the more you know about your customer the better able you’ll be to engage with and sell to them. That was true before we knew we should be concerned about the variety, velocity and volume (the 3Vs) of data. Marketers have always known there were nuggets of gold that could make or break their programs.
Knowing you need nuggets of gold, however, and actually doing the analysis to find those nuggets are two different things. Indeed, the hardest part of data analytics is, for many marketers, knowing where to start. Let’s face it. You don’t need me to tell you to use big data or analytics. That’s been sounded from the rooftops for the past five years (or more). What you need is guidance on how mining the data you have so you can gather insights and get to optimizing your customer experiences.
In this post, I will set a foundation for more to come about the how of analytics.
The States
Let’s be clear. It’s very natural that our skills vary. Practice, experience, and coaching, among other activities, help improve our abilities. Augmenting your aptitude is a journey and, as if with any journey, knowing where you are is key to getting where you want to go. You will find that the data prowess of every organization can be placed along one of five states. Within those states there are, in turn, five proficiencies that require various levels of mastery to reach successive states.
Below, I identify each state, the five proficiencies and the skills that are achieved within each. Let’s go!
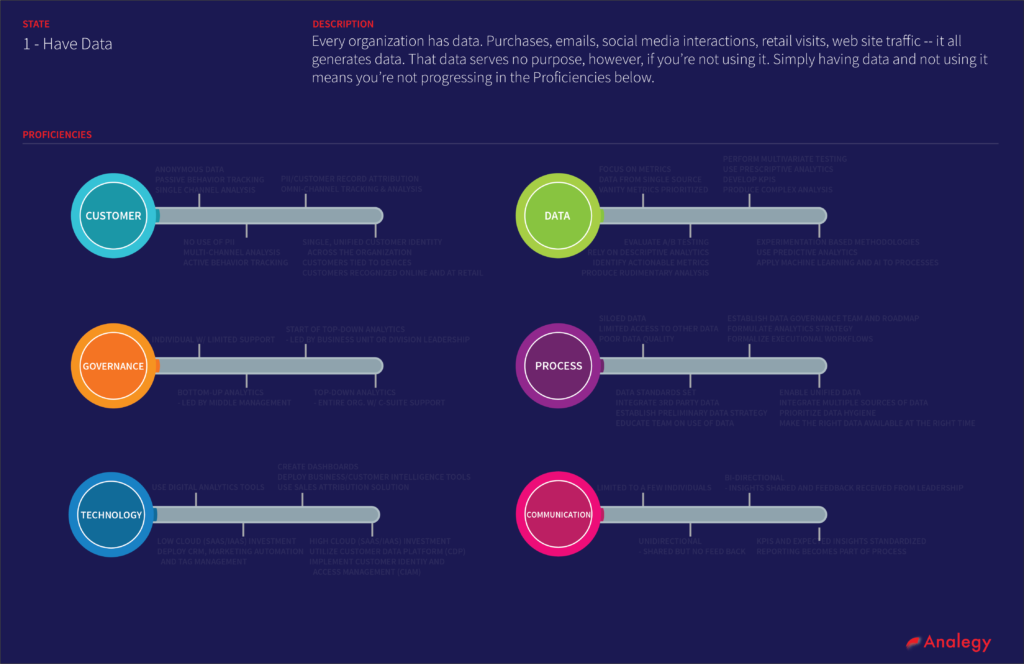
State 1 – Have Data
Regardless of the size of your organization, you have data. Every purchase, customer service contact, every website visit generates data. You may not use the data available to you often but it’s still there.
This state is marked by:
- Limited passive customer behavior tracking
- Few, if any, technology systems in place to analyze the data you have
- No processes in place to support data analysis
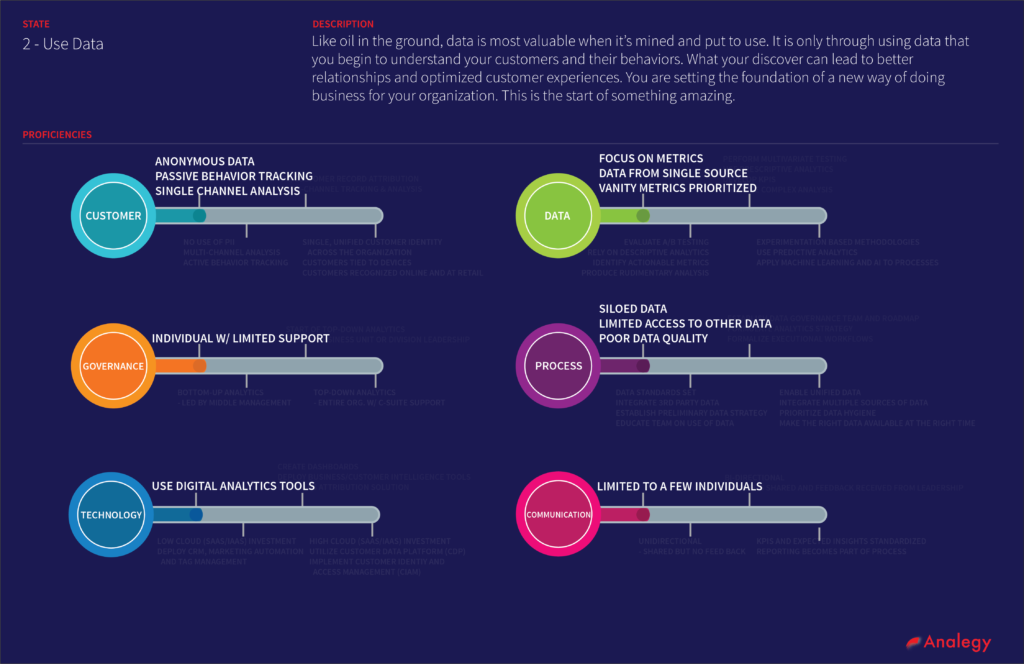
State 2 – Use Data
Like oil in the ground, data is valuable whether you use it or not. It is most valuable, however, when it is being used to generate insights that improve your business. Even rudimentary examinations into the behaviors exhibited in your data can unearth new discoveries and positively impact your relationships with your customers. Exploring and analyzing your data puts you and your team in a stronger position to refine and optimize the way you engage with your customers.
This state is marked by:
- Focus on metrics – especially, vanity metrics
- Analytics spearheaded by an individual or very small team
- Data, primarily, comes from a single source
- Little communication beyond the team
- Access to tools for digital analytics (i.e., web, social, email, ads, etc.)
- Poor data quality
- Limited access to 1st, 2nd or 3rd party data
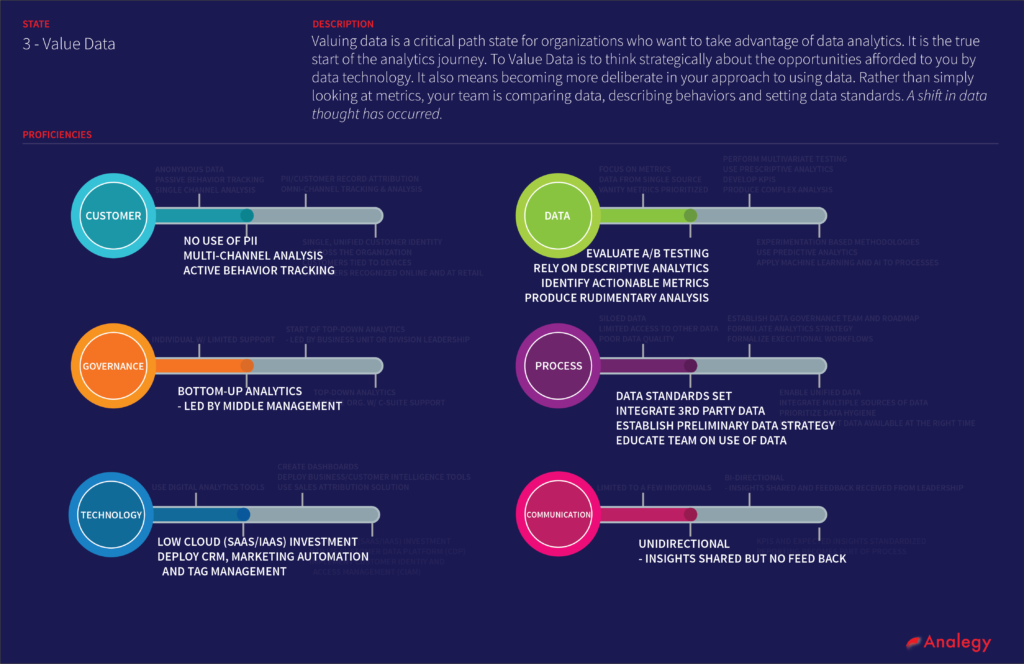
State 3 – Value Data
Value Data is the true start of the analytics journey. It is here when people begin to think more strategically about the opportunities afforded to them by data. They begin to truly value data and assign mindshare to the opportunities afforded by becoming an active participant in the management of the data you have. Performance metrics are prioritized over vanity metrics, goals are set and the tools used for visualization and analysis are more robust.
The hallmarks of this state include:
- Analysis of data across multiple channels
- Introduction of optimization methodologies like A/B testing
- Quantitative goal setting for project performance metrics
- Access to tools for digital analytics (i.e., web, social, email, ads, etc.)
- Analytics valued within a team and the team capturing metrics sends resulting information to other members of the team
- Multiple sources of data used to make analytics assessments
- Analytics is descriptive in nature — it describes the situation currently occurring without prescribing a course of action
- Metrics used are vanity metrics with little insight into customer behavior
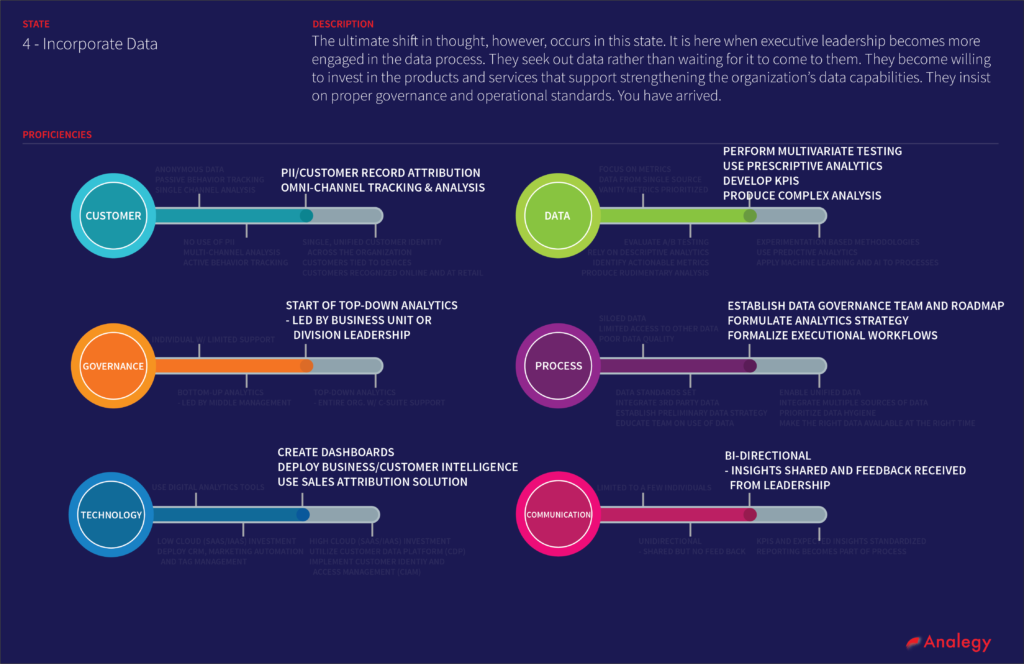
State 4 – Incorporate Data
The state change from valuing data to incorporating data is a small step but it represents a tidal shift in terms of mindset. Incorporate Data marks the moment the emphasis on using data is not driven by an individual or small team. This is true progress. It is as if the chrysalis emerges as a butterfly.
Incorporating data means the organization is beginning to awaken to the benefits offered by making data analysis (e.g. visualization, machine learning, artificial intelligence, etc.) a part of the day-to-day processes of the organization. It becomes clear to leadership that the insights captured from data can have a exceptionally positive impact on the business and the relationships with customers. This leads to greater investment in data analytics and intelligence resources.
The hallmarks of this state include:
- A measurement plan driven by leadership rather than individuals and teams
- Increased focus on making strategic decisions by turning metrics into key performance indicators
- Trackable data attributed to an individual with PII
- Customer experiences optimized using multivariate testing and experimentation
- Start of personalized customer experiences
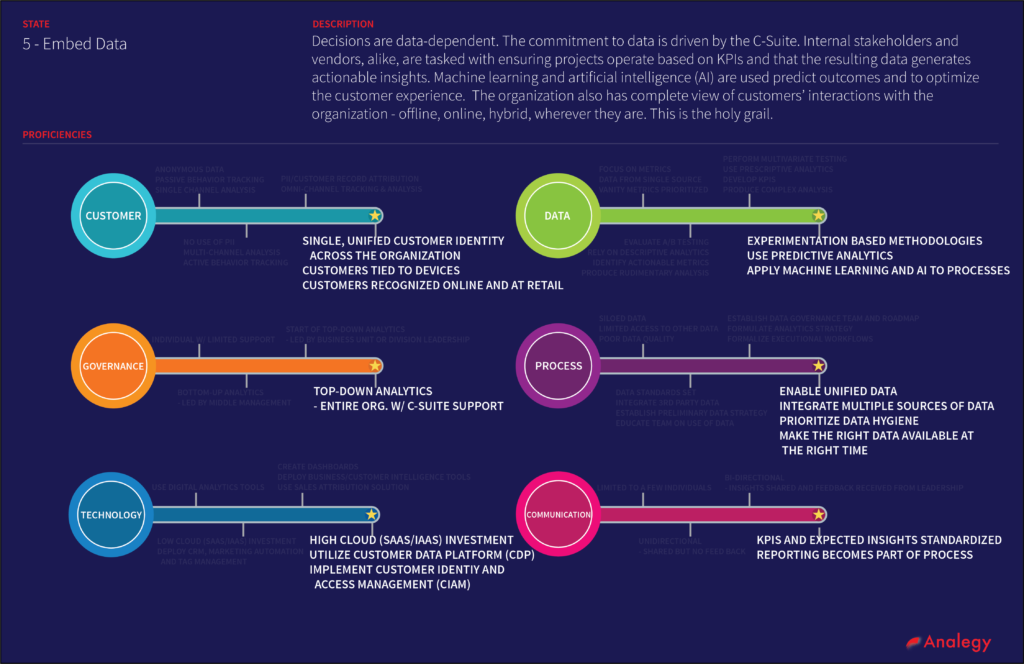
State 5 – Embed Data
Organizations that embed data live, breathe and sleep by the data process. These organizations are nimble and embed an experimental, hypothesis-based approach into their activities. Yes, they are data-driven. It’s more than that, though. Decisions are data-dependent. The dedication to data is driven by top management. Everyone works together to ensure that the data they need is available. Internal stakeholders and vendors, alike, are tasked with making data available and verifying the data’s quality. Additionally, there’s a commitment to having a complete view of customers’ interactions with the organization – offline, online, hybrid, wherever they are.
The hallmarks of this state include:
- C-Suite driven commitment to data
- Data-dependent decision-making throughout the organization
- Customer data and identity management
Wrapping Up…
Let’s be honest. Your organization may not fall precisely into exactly one state. Your C-suite may be driving change but it is slow going and you haven’t gotten much beyond A/B testing. That’s okay. The states should be considered a general guide. They’re progressive and provide a roadmap for moving from basic data analytics to a more fully expressed data management and analytics capability.
It is also important to note that every organization isn’t going to get to State 5 – Embed Data any time soon. I can’t say I honestly believe every organization needs to get there in the near term. Many do, however. Competitive pressures demand such. For those organizations, they should set a goal of getting to State 3 – Value Data as quickly as possible. It is there that the organization gets its first true taste of what’s possible with data. It’s the appetizer and it whets the appetite for more to come.
Question for you… Which state is your organization in and where does it want to go?